
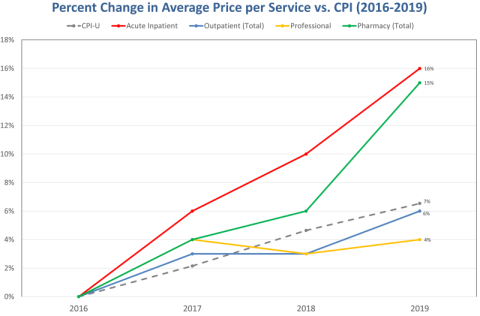
OLYMPIA, Wash. – A new analysis from Office of the Insurance Commissioner (OIC) shows health care costs for the commercial health insurance market increased 13% between 2016 and 2019 at the same time the consumer price index rose 7%.
“For years, we’ve seen the cost of health care grow, especially with advances in technology and prescription drugs,” said Insurance Commissioner Mike Kreidler. “These increases have impacted how much people pay for their health insurance. We need to get a handle on what’s driving costs if we want to address the issue and help lower health insurance premiums. This report helps us take a much closer look at what’s behind health care cost increases and understand whether it’s the use of health care services or their price that is contributing more to the growth in costs.”
Using claims data from Washington’s All-Payer Claims Database, Kreidler’s analysis looked at two key areas: How much health care was used and the price of each claim.
The report was produced by Onpoint Health Data and used data from Washington’s All-Payer Claims Database (www.hca.wa.gov). It looks at claims between 2016-2019 from state-regulated health insurance plans for people up to age 64 and identifies how much of the cost increases were due to increased use of services or price. It found the following areas of care were the most significant cost drivers:
- Pharmacy
- Acute inpatient care
- Outpatient emergency care
- Outpatient non-emergency care
- Ambulance
Among the key findings:
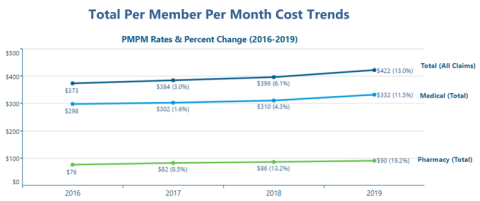
Total medical and pharmacy spending per member per month was $373 in 2016 and grew to $422 in 2019. Within this 13% increase, medical costs grew 11.5% while the cost of prescription drugs jumped 19.2%.
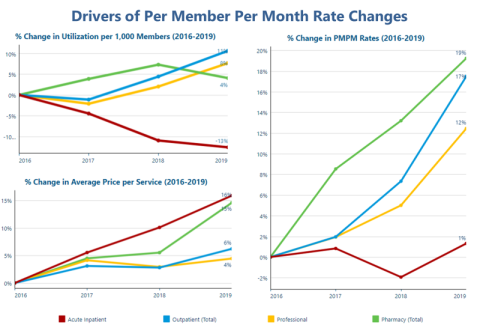
Health care costs are impacted by increased or decreased use of services and by changes in the price of services. The graphs below show percentage changes from 2016-2019 in health care service use, price and amount spent per person per month for four categories of health care services: inpatient services, outpatient services, professional services and prescription drugs.
The average price per service for both pharmacy and acute inpatient services outpaced inflation as measured by the consumer price index (CPI-U) over the period of 2016-2019. The graph below shows the average price per service change for the four categories of health care services mentioned, with CPI-U represented by the gray dashed line.
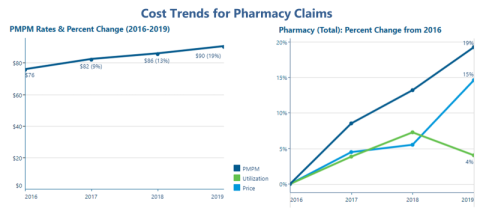
The 19.2% rise in pharmacy spending was driven by a 15% increase in the average cost to fill a prescription. At the same time, the number of prescriptions filled increased 4%.
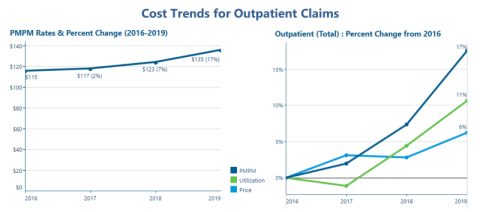
Outpatient services include emergency and non-emergency services provided in hospitals, ambulatory surgery centers or rural and community health centers. Those costs grew 17%.
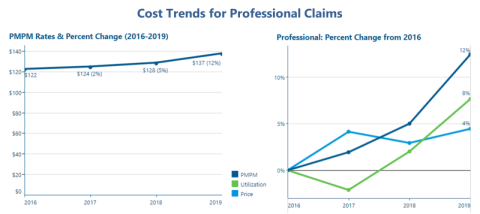
Health care “professional” services include services billed by physicians, psychologists, therapists and other types of health care professionals. These costs increased 12% over the four years.
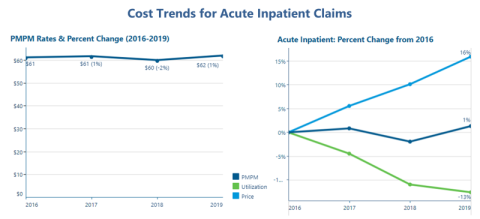
The per member per month cost for acute inpatient treatment stayed steady despite a 16% increase in price. This price increase was offset by a 13% reduction in use of inpatient care. Acute inpatient treatment includes behavioral health, maternity, medical care, and surgery in a hospital setting.
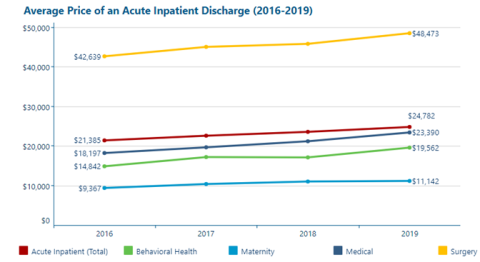
The average price for acute inpatient discharges increased for each category, with the behavioral health category seeing the largest increase of 31.8%.
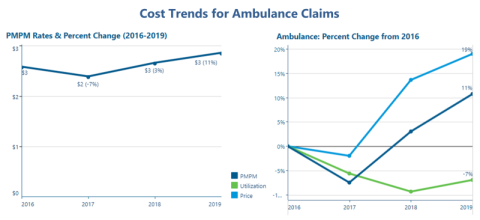
And finally, the average price of ambulance services increased 19%; however, the per member per month cost increase was only 11% because utilization decreased 7%.
These key findings present a window into how and why health care costs are increasing in Washington state. Over the next couple of months, the OIC will release additional data that provides a deeper look in three key areas:
- Prescription drugs
- Mental health
- Hospitals and ambulances
“Washington state has been hugely successful at improving access to health insurance for people who need coverage, and it’s something I’m very proud of,” said Kreidler. “But now we need to seriously tackle affordability. Understanding what’s behind the often paralyzing costs is the first step toward a solution.”